The 9PM 9minutes
On April 3 2020, at 9:10 hrs, The Hon’ble prime minister Narendra Modi while addressing to
the nation emphasized on the ongoing struggle, as the whole nation and as well as the world
is facing and, in the times, when the hope was settling, PM made an appeal to the citizens,
to introduce the power of the light (as mentioned Prakash) to the darkness of the corona and
defect it, PM mentioned to voluntarily turn off the lights at homes alone ,on April 5 2020 at
9:00 PM for nine minutes and light a lamp, diyas, mobile flash or torch, PM had mapped the
output to highlight the single battle that we all are fighting together, and none is alone.
This at the first glance may seem very easy task to execute, as we often take electricity
supply as granted, but its not completely true, electricity takes a long dynamic journey across
wide spread geographical areas, under scorching sun, freezing cold, and wetting rain, before
it reaches your home, the journey is as interesting as any of the Pankaj Tripathi’s movies
and his life, and mind you the journey of electricity employees many (so let’s praise it). The
entire power system can be divided into three units:1) Generation unit,2) Transmission
unit,3) Distribution unit. “One nation one gird” is the category in which Indian power system
falls in, it helps to send the power, which is generated at any corner of the nation, to any of
the places where it is necessary, Grid is the interconnected network to supply electricity from
producer to consumer.
Power System Operation Corporation Limited (POSOCO), is a Government of India
enterprise under Ministry of Power, it holds the responsibility of integrated operation of the
grid in a reliable and efficient way, it has a main section called National Load Dispatch
Centre (NLDC), NLDC in turn is divided into five Regional Load Dispatch Centers (RLDC),
Northern Regional Load Dispatch Centre (NRLDC) and such like, SRLDC, ERLDC, WRLDC
and NERLDC. And every state has State Load Dispatch Centre (SLDC)
HOW 9PM 9MINUTES CHALLENGED THE POWER SECTOR?
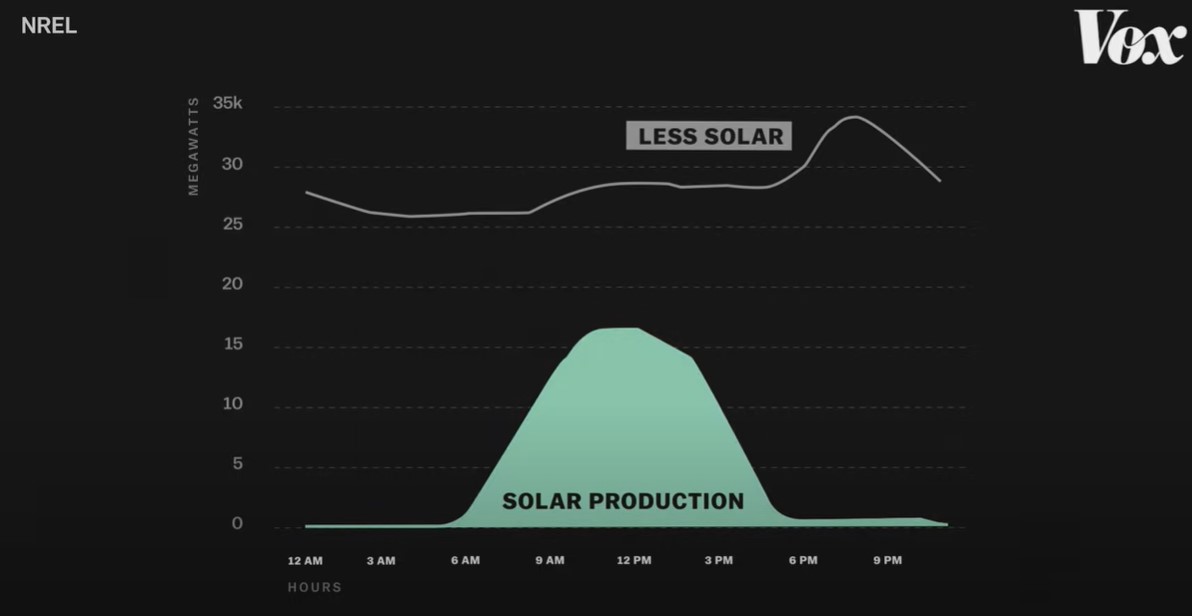
Since entire country was under complete lockdown, almost all the industries were off, due to
which the overall load demand was reduced by 20 percent, nearly 220-240 lines at 400 kV
voltage level and above were kept in open circuit condition for voltage control, the major load
consuming sectors were domestics, hospitals and such like. And the previous alike event of
clapping and cheering from the balcony had received humongous response, which was
intended to show support to the corona warriors, all these similar factors were strong points
to believe the promising response to the 9PM9minutes, so the power sector had planned
meticulously to tackle this engineering opportunity
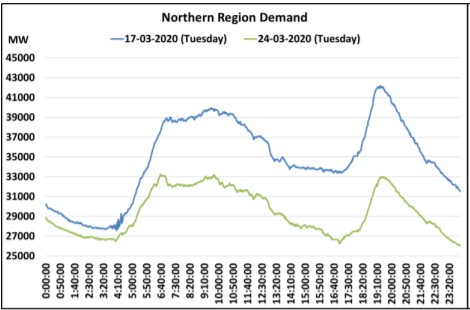
The event was unique and very dynamic in its own ways, since it involved in a hugh
reduction of, all India lightning load for 9minutes and a sudden increase in the same. The
current that is supplied is of alternating types and called alternating current (AC), it is
chacterised by having a frequency, the standard frequency at which the power system works
is 50 hertz (in India), the range provided by POSOCO is 49.70 hertz- 50.26 hertz, violating
these frequencies would lead to system failure, as we are aware of weather forecasting,
there is also something called as load forecasting, this was the starting key task to
successful organizing of this event, based on the analysis the all India lightning load was
estimated and demand reduction of 11344 megawatt (MW) at 9 PM was anticipated but the
actual reduction had surpassed the estimated value. The reduction in load was not a
problem but the sudden dip and then a sharp increase in load demand was a hugh concern,
since the mechanical input would be the same to the generators, but the electrical output
would have been reduced so drastically, so generator will pick up the speed, by increasing
the speed of generator, the frequency would also increase, so does the induced emf (electro
motive force)/voltage (according to Faradays law), and as we know the increase in
frequency is not valid. A simple analogy to understand the problem would be of a, vehicle
moving at x km/hr with 10 passengers, suddenly the passengers dropping to 2 will certainly
speeds up the vehicle and it will be little tedious to control the vehicle, the same can be
explained using Swing equation, talks about the power system stability.
SO HOW WAS THIS ISSUE APPROACHED?
Around 8:55 pm (on April 5 2020) the frequency (of every generating station all over the
country) was maintained as low as possible (of the limited range), since anyhow the
frequency would have raised latter at 9:00 pm, we have to understand that the different kind
of power plant needs different time to pull up their socks, because of various reasons.
Around 6:30 pm gas based units under reserve shut down were brought back on board,
around 7:30 pm the thermal units were gradually brought down, which were ramped up to
meet the evening peak demand, to compensate the thermal units hydro units were ramped
up around 8:45 pm thermal units were backed to lowest technical level and hydro units
ramped to maximum, sharp reduction in all India lighting demand started around 8:45 pm
from116887 MW, around 9:10 PM, minimum all India demand was recorded, it was 85799
MW , at 9:10 PM all India demand started to raise, around 10:10 pm all India demand settled
at 114000 MW.
This was just a vague attempt to draw the wonderful aspect of the dynamic power system
and the meticulous approach by the engineers and the entire management along with the
government support to maintain the grid so that the entire nation will continue to work with
brighter hope.
Akshay Avate
B.Tech in Electrical and Electronics, Central University of Karnataka